The Labs Team builds tools that help the public understand vast MBTA-related data. Our flagship project, the Data Dashboard, offers insight into MBTA performance, ridership, and service quality. We also maintain our New Train Tracker, Regional Rail Explorer, and COVID Recovery Dashboard.
Transit Data Challenge People's Choice Award Winners!
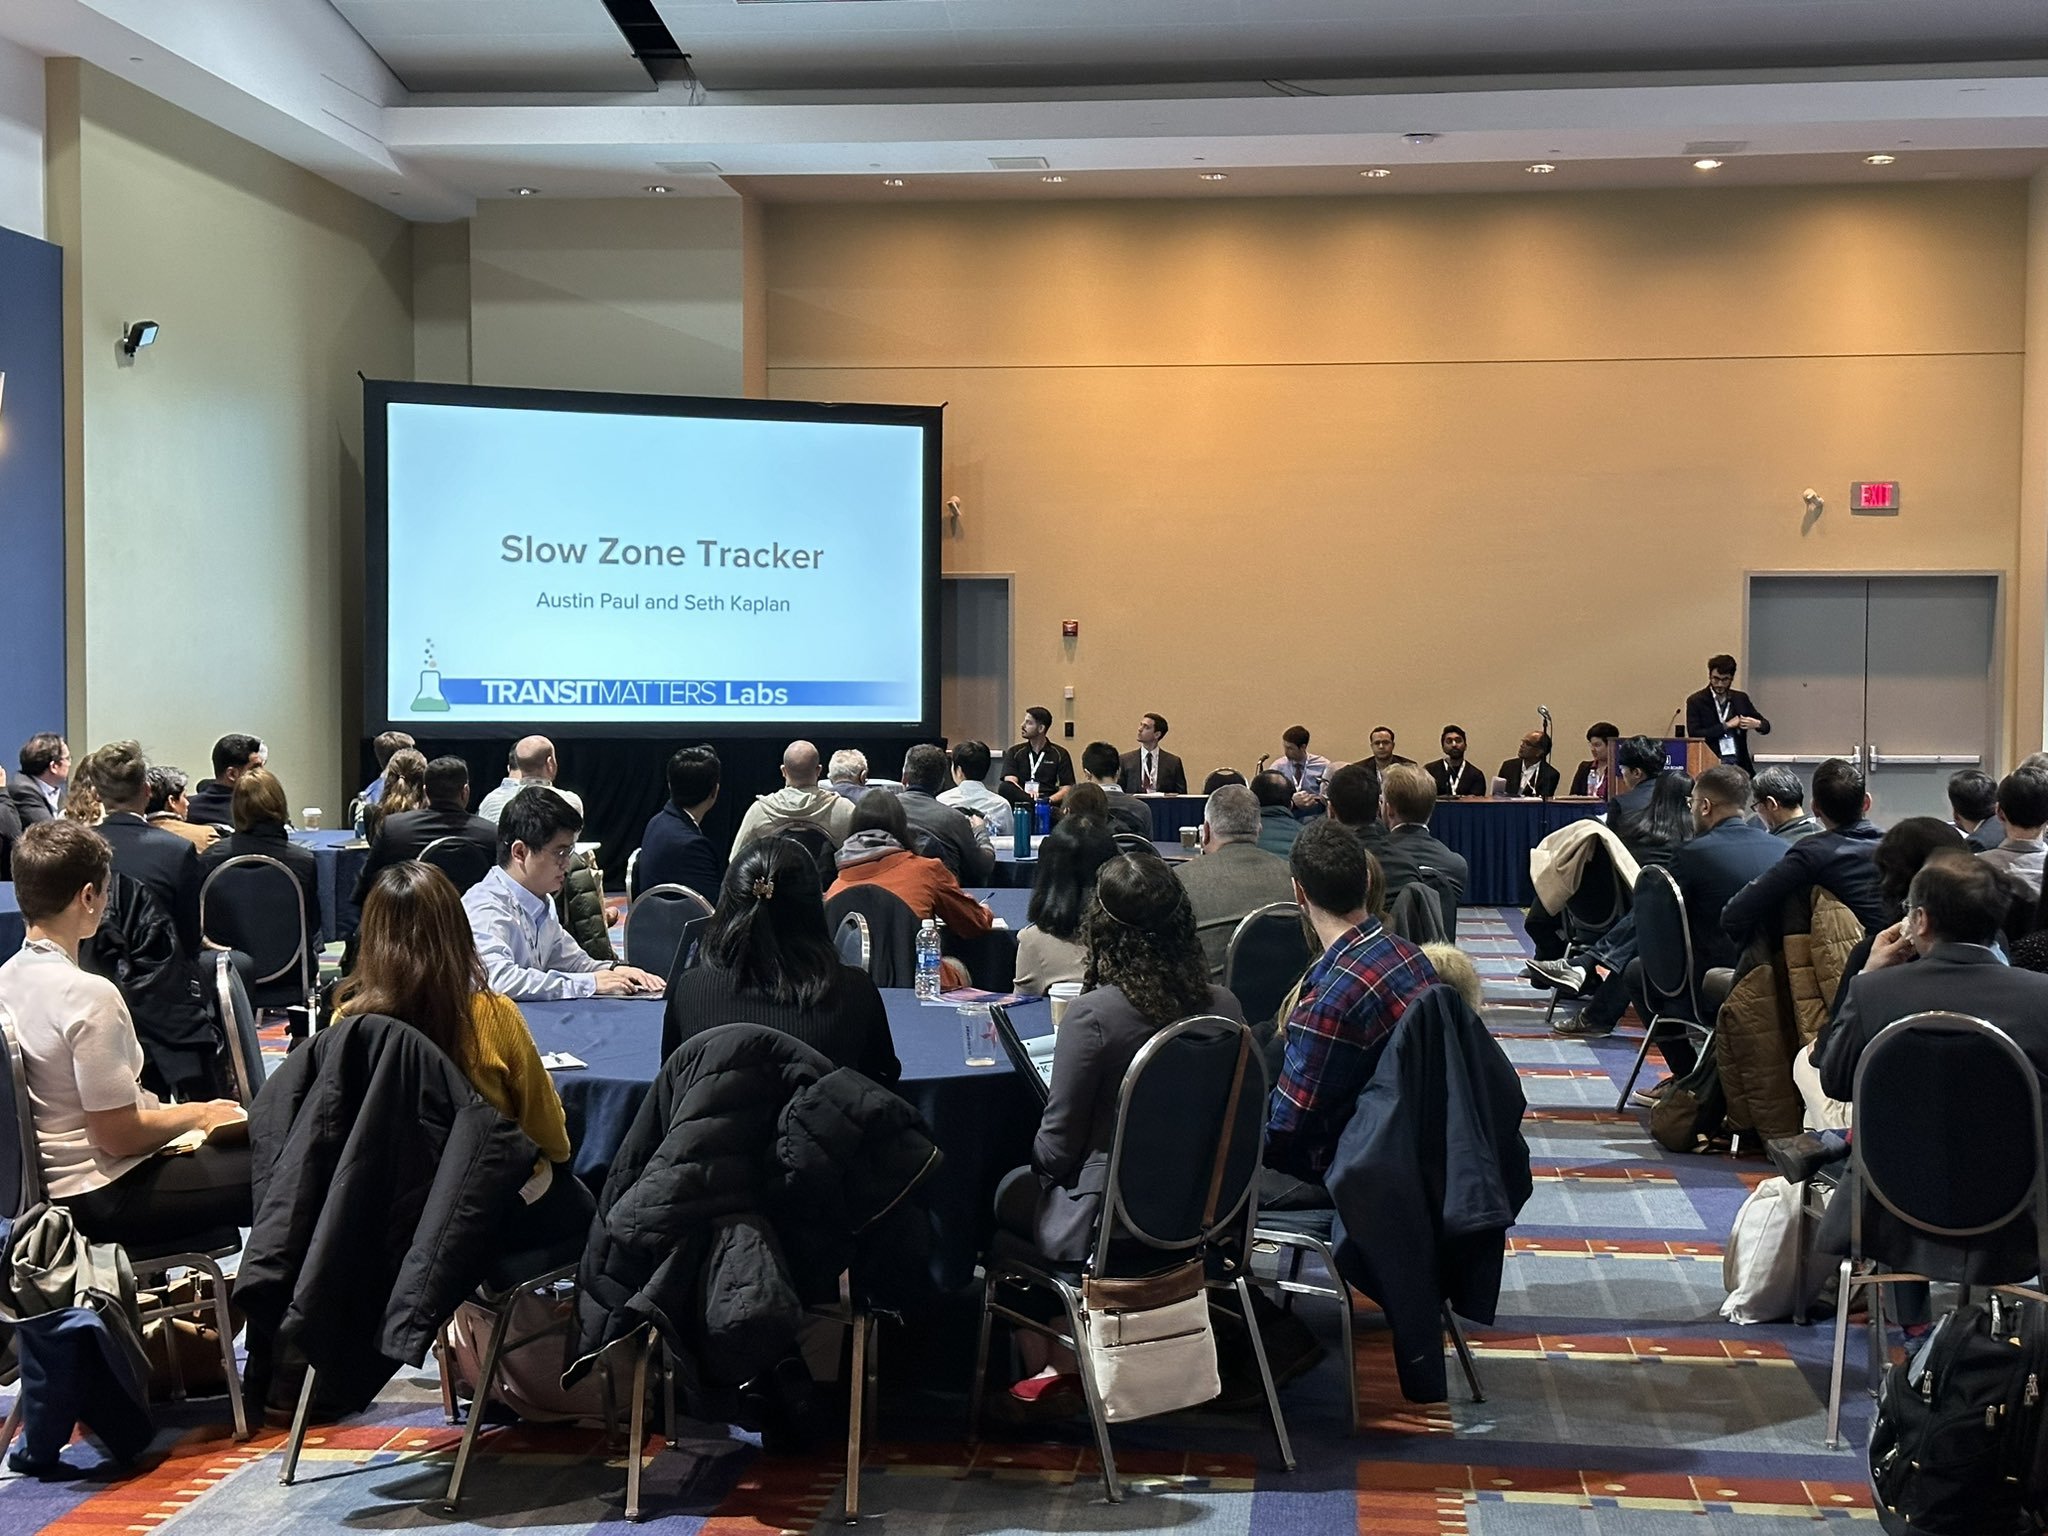
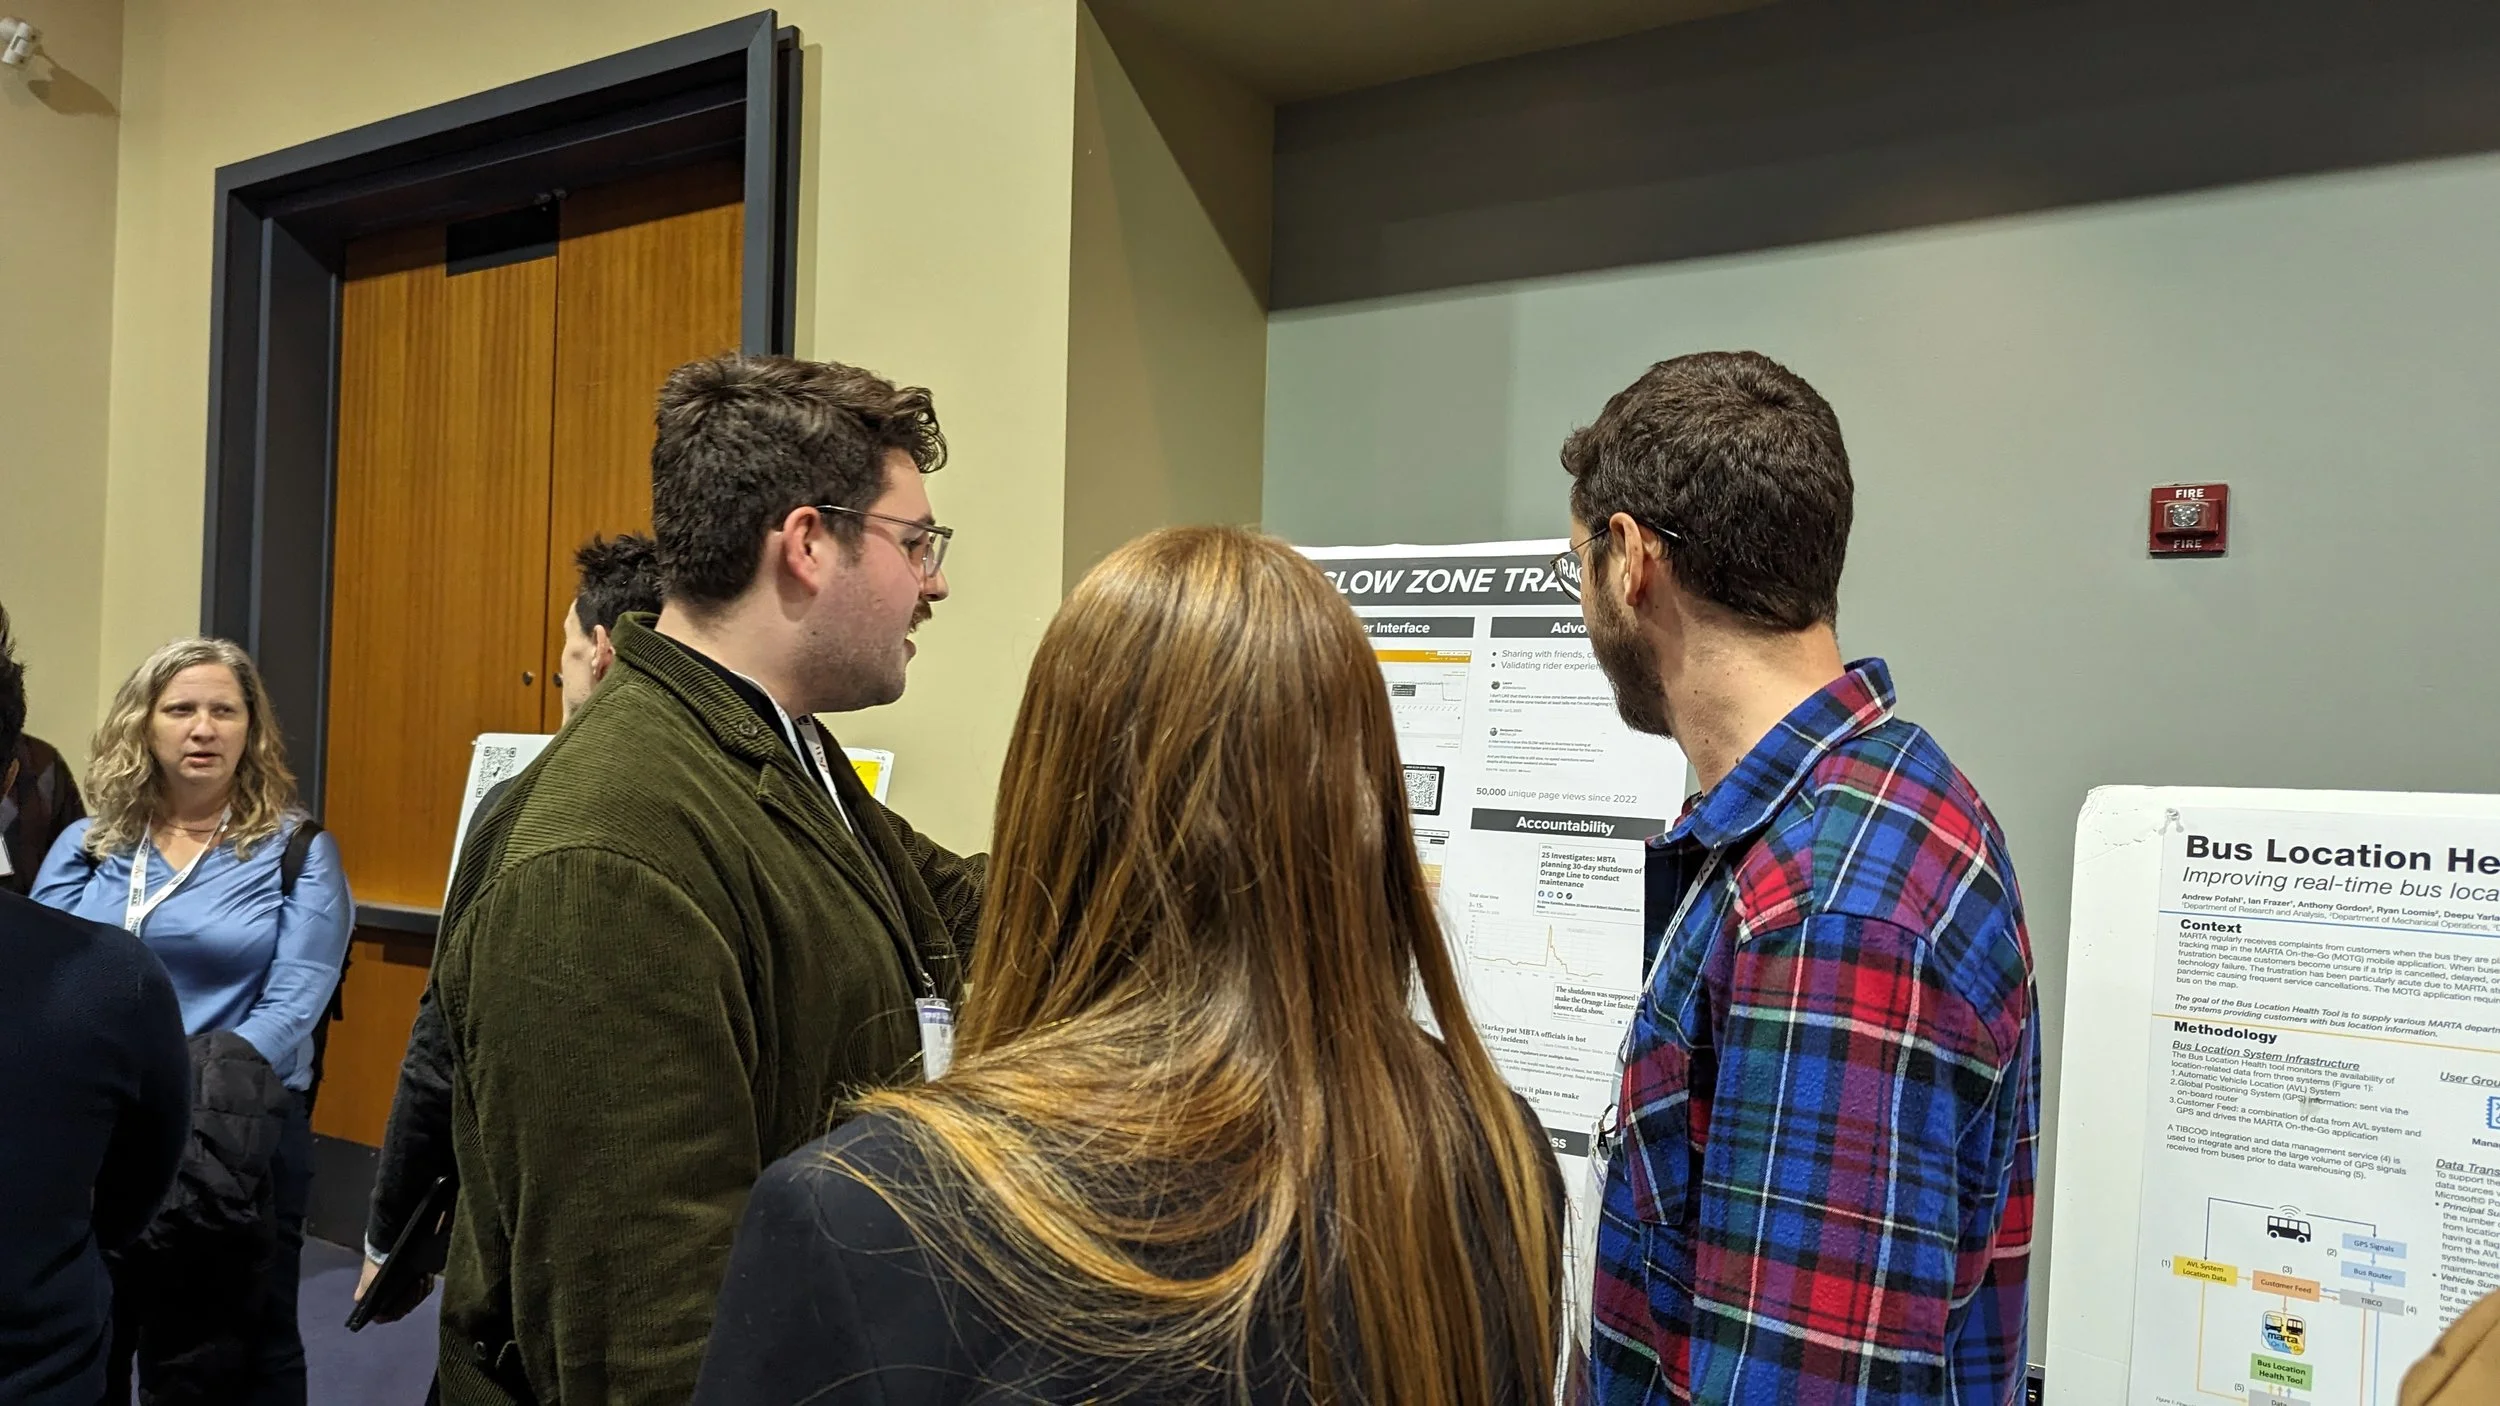
Congratulations to the TransitMatters Labs team for winning the Transit Data Challenge People's Choice Award at the Transportation Research Board Annual Meeting!
TransItmatters Labs Co-Leads:
Labs Projects
FEATURES (v4.0):
Check out the all-new TransitMatters Data Dashboard version 4, offering at-a-glance views of MBTA performance & trends. Service, slow zones, speed, ridership, and trip analysis are a click away for transit advocates, media and the public. See our blog post for details on the release & data-centric advocacy.
FEATURES (v1.0):
See pre-covid ridership* compared to now on a daily basis & also view service levels and ridership* dating back to February 2020!
From the subway to the bus to the commuter rail, you can filter by line and access data from across the MBTA system. Data can be sorted in a variety of ways, with service kind, most ridership*, or most service cuts being just three of many options.
*Rapid Transit (Red/Orange/Blue/Green) ridership estimates represent gated station validations only. Bus ridership estimates are calculated using APCs (automated people counters) installed on a majority of buses.
FEATURES (v2.0):
Track where the MBTA’s newest Orange, Green and Red Line trains are and catch a ride on one!
send us feedback: Labs@transitmatters.org
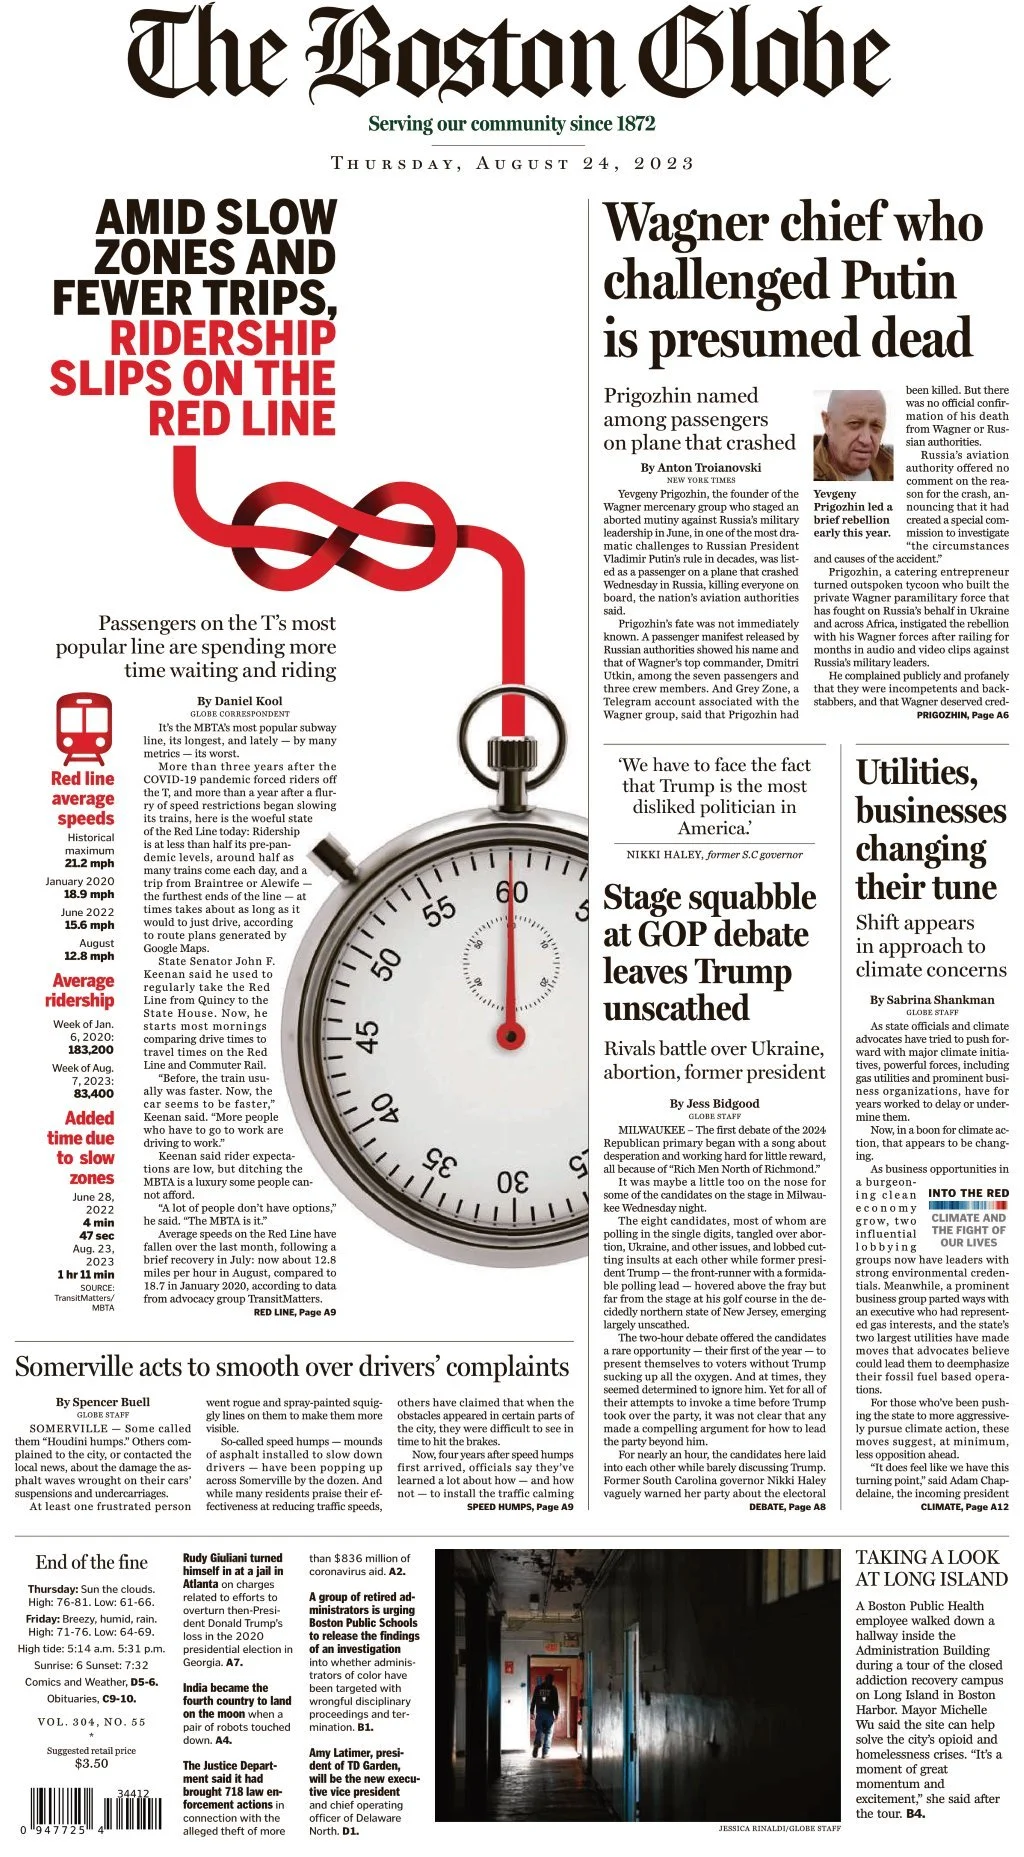
press coverage
Average speeds on the Red Line have fallen over the last month, following a brief recovery in July: now about 12.8 miles per hour in August, compared to 18.7 in January 2020, according to data from advocacy group TransitMatters.
And riders say they can feel it.
Daniel Kool | The Boston Globe
While conditions have improved on the Orange Line, Red Line riders have seen mounting delays in recent months.
Abby Patkin | Boston.com
On October 14, 2022, TransitMatters Executive Director Jarred Johnson testified with Mayor Wu at the Senate Committee on Banking, Housing and Urban Affairs’ Subcommittee on Economic Policy hearing.
If the Orange Line feels slower to you than before the shutdown, you’re not imagining it.
Taylor Dolven | The Boston Globe
Blog posts
On October 30, the MBTA announced the successful completion of the shutdown and that “all speed restrictions that were in place prior to the shutdown have been alleviated in this area.” TransitMatters wondered: did the T, as Eng promised, clear this section of the system of slow zones?
There are many ways to measure service quality, and TransitMatters has explored several of them. Some have landed in the Boston Globe, and others have gotten traction on social media. The new dashboard makes it easier to explore some key metrics.
After eight months of tracking slow zones, we’ve decided to make some changes to our calculation methodology. These changes are going live today, and we’re excited to share them with you. What follows is an in-depth description of what we changed.
FEATURES (v1.0):
Compare trips on the current unreliable, infrequent dirty diesel Commuter Rail vs reliable, frequent, electrified Regional Rail! Select when you want to leave or when you want to arrive. Where will Regional Rail take you?